Blue Cat's Analysis Pack is a bundle of six professional audio analysis plug-ins that covers metering, spectrum analysis, oscilloscope, and stereo imaging, but if you're on Windows, particularly in Pro Tools, you need to know about reported crashes during installation and when moving plug-ins between tracks before you spend anything.
Quick verdict: This is one of the more complete analysis bundles available for a DAW-based workflow. The six tools cover real ground, the CPU footprint is light, and the ability to send MIDI CC or automation data from your analyzers is a genuinely clever design move that most competing tools skip. The scoring reflects the bundle's real strength in what it measures and how it integrates, docked for Windows reliability problems and a visual presentation that hasn't kept up with the times. If your studio runs on a Mac and your sessions demand serious analysis across multiple tracks simultaneously, this is a bundle worth your time. If you're on Windows in Pro Tools, go in with your eyes open.
The Catch Up Front
The honest thing to say first: Windows users, especially Pro Tools users on Windows, have reported crashes during installation and when moving plug-ins between tracks. That's not a minor inconvenience. It's a session-killing problem if you're working on a deadline.
Beyond that specific stability issue, there are broader performance complaints on Windows that show up in owner reports. The bundle runs on Windows 7, 8, and 10, and supports both 32-bit and 64-bit DAWs, but the reports suggest the experience is not as smooth as the developer's feature list implies.
Mac users running Audio Units, VST, VST3, or AAX have a significantly better track record here. The bundle supports macOS from 10.7 through Catalina and Big Sur. If that's your environment, the stability problems in the notes largely don't apply to you.
The other thing to flag before anything else: the visual design. Owners and reviewers don't praise the interface aesthetics, and the minimal discussion around it suggests the UI has not been modernised to match what producers expect from a plug-in in this category today. That won't bother you if you care about data over decoration. But it will bother some people.
What You Get If You Clear It
The bundle ships six distinct plug-ins. Each one handles a different layer of signal analysis, and they're designed to be used together across your session rather than as standalone tools.
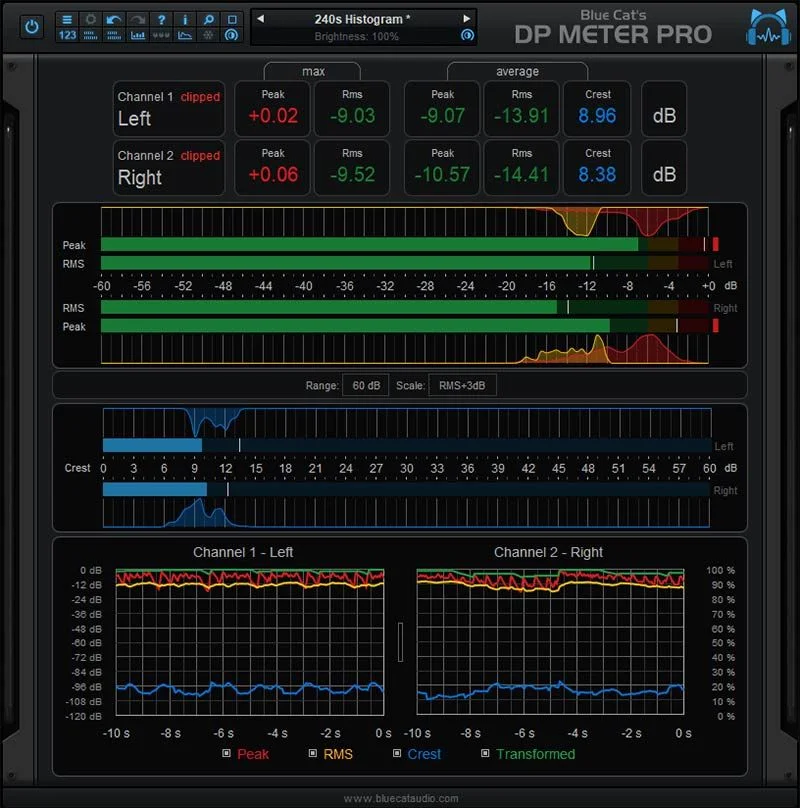
DP Meter Pro handles multichannel peak, RMS, and crest factor metering. It includes true dynamic range measurement, levels histograms, Bob Katz's K-System scales (K-12, K-14, K-20), and custom scale support. It analyzes mono, stereo, mid-side, and surround audio. And it records measurements as automation curves while outputting MIDI CC messages. It can even drive side chain ducking and compression via its envelope shaping.
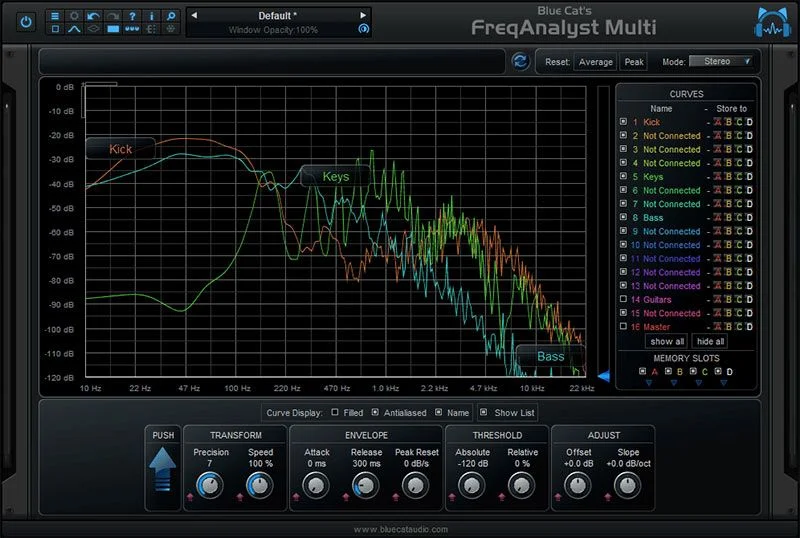
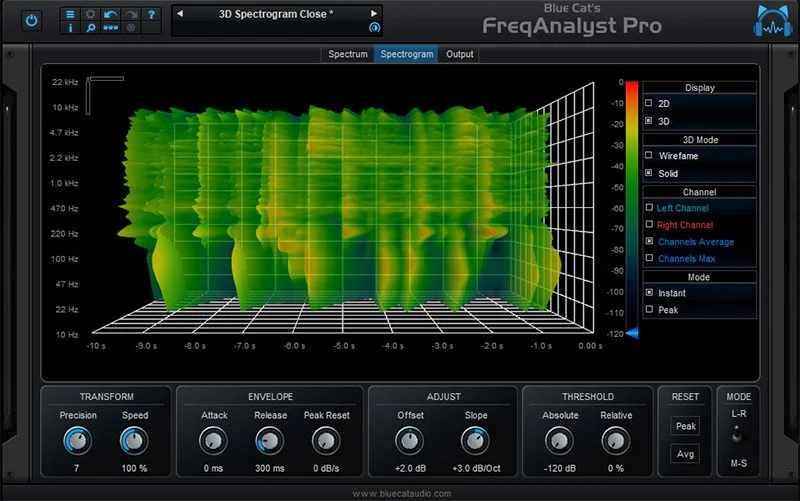
FreqAnalyst Multi displays the spectrum of up to 16 audio tracks simultaneously on one screen, in real time, with difference display for EQ matching. FreqAnalyst Pro adds mono, stereo, or mid-side real-time spectrum analysis with 2D and 3D waterfall spectrogram views and automation or MIDI output from frequency and energy data.
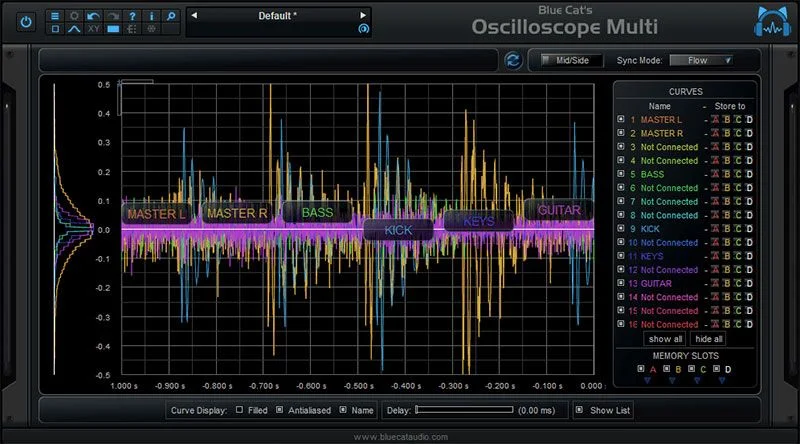
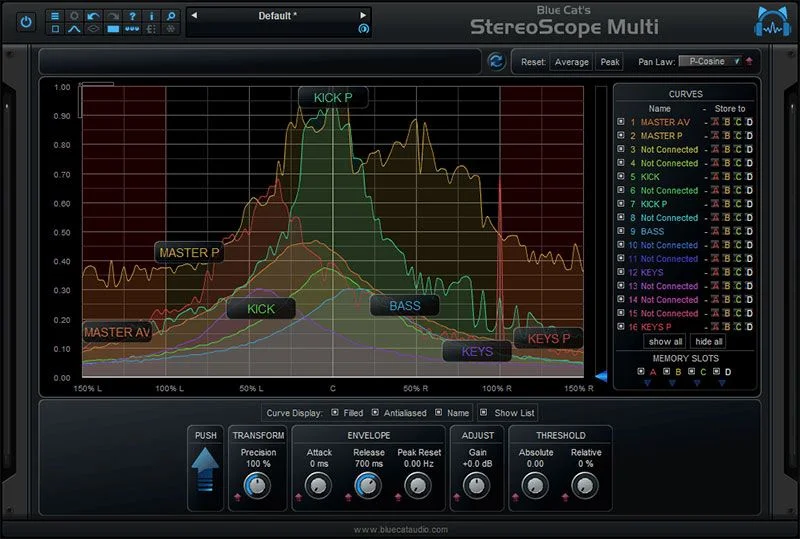
Oscilloscope Multi shows waveforms from up to 16 tracks at once with XY phase scope (Lissajous) view, histogram display, four memory slots, and latency compensation. StereoScope Multi and StereoScope Pro cover stereo imaging across multiple tracks and in detailed single-track views, with the Pro version including an integrated correlation meter and 3D waterfall.
DP Meter Pro: The Metering Engine
When you're working to a loudness target and need to know exactly what's happening at every stage of your signal chain, DP Meter Pro is where you start. Load it at the end of your master bus and it shows you peak, RMS, and crest factor simultaneously. That combination tells you not just how loud the signal is but how dynamic it is.
The crest factor reading is the gap between peak and RMS. Watch it narrow as you add compression. When it gets too tight, you're squashing the life out of the mix. That's a number to track, not a vibe to feel.
The K-System support is a real practical feature. Bob Katz's K-12, K-14, and K-20 scales give you a loudness calibration framework that keeps your monitoring honest across different program types. K-20 for classical and film, K-14 for most music, K-12 for broadcast. Load the right scale for your target medium and your ears stop fighting your meters.
Levels histograms show you the distribution of your signal levels over time, not just the current moment. Put DP Meter Pro on a vocal bus and let it run for a verse. The histogram tells you where the vocal actually lives dynamically, which informs every compression and limiting decision you make after it.
The mid-side capability matters here too. Put it on your master and switch to mid-side mode. You'll see immediately if your sides are overloaded relative to your mid, which is a common mastering-stage problem that mono compatibility checks alone won't catch.
The standout feature, though, is what it can do beyond display. DP Meter Pro measures stereoness and phase cancellation. It records measurements as automation curves. It outputs MIDI CC messages. This turns your meter into an active element of the signal chain, not just a readout. Owners report the envelope generators with precise control over envelopes and sidechain signal selection create unlimited possibilities. That's not marketing language if you understand what it means: you can automate plug-in parameters downstream based on what DP Meter Pro is measuring upstream.
If you're working in post-production and need to generate automation from loudness data, this is the kind of feature that makes your whole session smarter. It's also an underrated use case for music producers who want volume riding that tracks the actual dynamics of a track rather than a hand-drawn curve.
FreqAnalyst Multi: Seeing the Whole Mix at Once
This one deserves more attention than it typically gets in discussions of the bundle. The concept is simple: load FreqAnalyst Multi as a send on every track in your session, and all the spectra appear on one screen at the same time. Up to 16 curves simultaneously, each in a different colour, all updating in real time.
What that lets you do is find frequency overlap without guessing. You're mixing a session with two guitars, a piano, and a synth pad. They all live somewhere between 200Hz and 4kHz. Without a tool like this, you're pulling at EQ moves until things start separating. With FreqAnalyst Multi open, you can see exactly where the guitar's midrange peak sits against the piano's presence, and you cut the right one with a real number instead of a feeling.
The difference display is where this becomes genuinely useful for EQ matching. Load a reference track, load your mix, switch to difference mode, and you see exactly what your mix has more or less of compared to the reference. That's not an approximation. It's the actual spectral gap. Set your EQ to close it.
Instant, peak, and average curves are available for each track independently. For something like a room mic on a drum kit, the peak curve shows you where the transients are smashing the spectrum. The average curve shows you where the sustained tone lives. Those are two different pieces of information and you want both.
The multi-core processor support through Blue Cat's data sharing technology is what keeps this from becoming a CPU problem. Running 16 real-time spectrum analyzers simultaneously would normally be a tax on your session. Owners report minimal CPU usage, which lines up with the data sharing approach: one analysis engine feeds all 16 displays rather than 16 independent engines running in parallel.
Zooming and precise measurement with note info display means you can click into a frequency and see which musical note it corresponds to. That's useful when you're chasing a resonance and you want to describe it to a session musician or write it down for recall.
If you're mixing a dense session with a lot of competing midrange instruments, this is probably the tool in the bundle you'll open most often.
FreqAnalyst Pro: When You Need the Full Spectrum Picture
Where FreqAnalyst Multi is built for multi-track comparison, FreqAnalyst Pro goes deeper on a single source. The 2D spectrogram shows you how the frequency content of a signal changes over time. The 3D waterfall mode adds a third axis, letting you scroll back through the history of the spectrum in a visual that's genuinely satisfying to look at when it's working properly.
The 3D waterfall view has full 3D control, meaning you can rotate and navigate the display to look at the spectrum from different angles. This is more useful than it sounds for certain diagnostic tasks. If you're chasing a problem that only appears at a specific moment in a track, being able to scroll back through the 3D history and find the exact moment is faster than setting loop points and listening repeatedly.
The mid-side mode in FreqAnalyst Pro is worth using on problem sources. Load it on a stereo bus and switch to mid-side. If the sides have a spectral hump the mid doesn't have, that's a width problem you need to address before the mix reaches mastering. Without a tool that shows you mid and side spectra separately, that kind of problem is hard to diagnose.
The automation and MIDI output from FreqAnalyst Pro is another feature that separates it from a standard spectrum analyzer. It can output MIDI CC messages tracking minimum frequency, maximum frequency, and energy center. If you're doing sound design and want to modulate a plug-in parameter based on the spectral centre of a source signal, FreqAnalyst Pro can generate that control signal for you. That's a sound design workflow that most producers haven't tried and most analyzers don't support.
The honest thing to say about the 3D view is that it looks dated compared to what newer analysis tools offer visually. The functionality is sound. The presentation doesn't inspire confidence in the same way a modern interface would. That's not a dealbreaker for the information it gives you, but it's not nothing either.
Oscilloscope Multi: Phase Is Not Optional
Phase problems in a recording are frustrating because they're often invisible until something sounds wrong in mono. The Oscilloscope Multi is built to make them visible before they become a problem in the bounce.
Load it on two tracks that you suspect are phase-related and you can display both waveforms on the same screen with latency compensation to align them. No more flipping the phase switch and guessing whether it helped.
The XY phase scope, also called a Lissajous display, shows the phase relationship between two signals as a two-dimensional shape. A perfect circle means the signals are 90 degrees out of phase. A perfect diagonal line means they're in phase. Anything in between tells you something about the correlation. When that shape starts looking like a horizontal smear, you have a cancellation problem.
The developer specifically flags using Oscilloscope Multi to track phase issues within effect chains. Load it before and after a plug-in that you suspect is introducing phase rotation. Store the before-waveform in one of the four memory slots and compare it against the after-waveform. If the phase has shifted, you'll see it. That's a diagnostic capability that's genuinely useful when you're chasing a weird narrowing or cancellation artifact in your chain.
Multi-microphone recording is the other obvious use case the developer points to. Drum recording with multiple mics across kick, snare, overheads, and room is a phase minefield. Having Oscilloscope Multi open during tracking and during mix gives you an objective read on what the mic placement is actually doing to phase coherence.
Up to 16 curves on the same screen, with four memory slots for stored waveforms, means you're not limited to comparing two signals. You can store a reference waveform, compare three live sources against it, and step through the memory slots to see the history. For systematic multi-mic alignment, that's a workflow that saves time.
The histogram display for waveform value distribution is a less obvious feature but it's worth knowing about. It shows you how often the waveform hits specific amplitude values.
Honestly, this is probably the least-discussed tool in the bundle but it's one of the most practically useful during tracking sessions.
StereoScope Multi: Width Across the Whole Session
Width is one of those things that's easy to manage on a single track and surprisingly hard to manage across a full session. StereoScope Multi lets you see the stereo image of up to 16 tracks simultaneously, with the same colour-coded multi-curve approach as FreqAnalyst Multi.
When you're mixing and your stereo bus is widening in a way that's making things feel washy or unfocused, you need to know which tracks are contributing the most width energy. Without a tool like this, you're muting and soloing tracks one at a time to find the culprit. With StereoScope Multi open, you can see all 16 stereo images at once and identify immediately which one is spreading further than it should.
The difference display between curves is built for response curve measurement, the same way FreqAnalyst Multi uses it. That's useful if you're trying to match the stereo width behaviour of a reference track against your own mix. Load both, run the difference view, and you see exactly where the spread is different.
Instant, peak, and average stereo image curves for each track give you the same three-layer view you get in FreqAnalyst Multi. The average curve over a full song section is more meaningful for width decisions than any single snapshot, because stereo image fluctuates constantly during playback.
The practical workflow here is to use StereoScope Multi as a session-wide health check. Run through the arrangement and watch the width curves. If anything is pushing unexpectedly wide or suddenly collapsing to mono, you'll see it in the multi-track view before it makes it into the bounce.
StereoScope Pro: The Single-Source Deep Dive
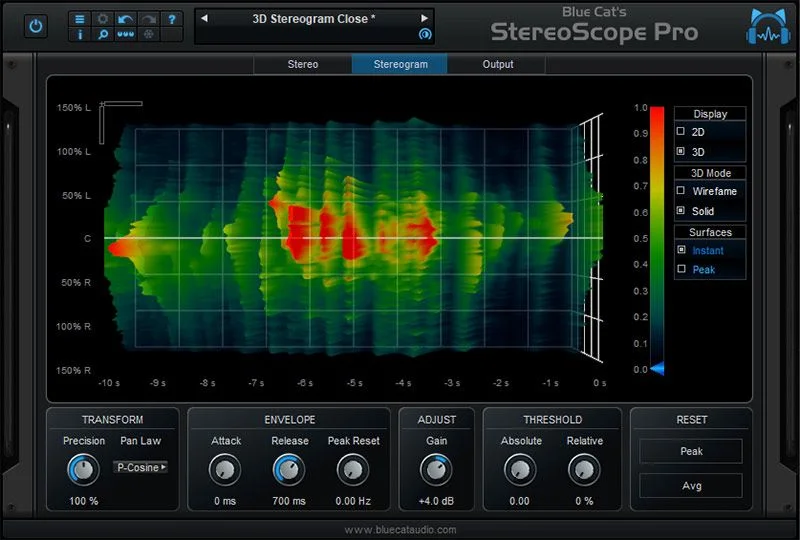
StereoScope Pro is where you go when you need to understand a single source's stereo behaviour in granular detail. Three distinct views are available: the stereo image view, the stereogram, and an output parameters view. Each tells you something different about how the signal occupies the stereo field.
The stereo image view is your primary display. It shows you where the signal is perceived to sit in the stereo field at any given moment. The stereogram adds a time dimension, showing how that position has evolved over the last few seconds. If you're mixing a synth pad that should be wide and stable but is pumping or shifting because of modulation, the stereogram makes that movement visible.
The 3D waterfall view brings the same time-history functionality from FreqAnalyst Pro into the stereo domain. You can scroll back through the stereo field behaviour over time. For detailed post-production work where specific moments in a programme need to be audited for stereo compliance, this is a useful diagnostic view.
The integrated correlation meter in StereoScope Pro is genuinely useful for mastering and broadcast work. Correlation measures how similar the left and right channels are. A reading of +1 means the signal is mono. A reading of -1 means the left and right channels are inverted, which causes total cancellation in mono. If it's regularly dipping below zero, you have a mono compatibility problem.
The MIDI CC output from StereoScope Pro tracks minimum and maximum stereo field positions and perceived position. Those values can be routed to automate parameters in other plug-ins. If you're doing immersive audio work and want to track an object's perceived position through space using the stereo field data as a control signal, that's a creative possibility that standard stereo analyzers don't offer.
The love for StereoScope Pro from owners is specifically around the display customisation and the precision of the envelope control. That tracks. The three-view approach gives you enough angles on the stereo field that you can make specific, confident decisions rather than approximate ones.
The MIDI and Automation Output Angle
This is the design decision that separates the Analysis Pack from a collection of meters and scopes. Almost every tool in the bundle outputs MIDI CC messages or generates automation curves from whatever it's measuring. That turns every analyzer into a potential control source.
Think about what that means in practice. DP Meter Pro can output an automation curve based on RMS level, which can be routed to a volume fader or a compressor parameter downstream. You've just created a metering-driven gain rider that responds to the actual dynamic behaviour of the vocal rather than a fixed curve you drew by hand.
FreqAnalyst Pro can output MIDI tracking the energy centre of the music, which can be routed to modulate a sidechain threshold or a highpass filter cutoff on the music channel. The dialogue stays clear because the music is responding to its own spectral data.
These are not obvious use cases and the bundle doesn't advertise them loudly. But the owners who've discovered them describe the envelope generators as offering what they call unlimited possibilities. That's not an overstatement if you're working in a DAW that can receive MIDI from plug-ins and route it to parameters.
The sidechain ducking and compression via DP Meter Pro's envelope shaping sits in the same category. You can shape the envelope that the meter generates before it reaches the sidechain. That means you're not just ducking hard on every transient. You can smooth the envelope, add attack and release characteristics, and create a more musical dynamic response than a fixed threshold-based sidechain would give you.
It's a clever system. The question is whether you work in a way that takes advantage of it. If you don't use automation much and you're not doing post-production, the MIDI output is a feature you'll ignore. If you do, it's brilliant.
CPU and Performance: What Owners Say
Owners consistently report lightweight and efficient performance with minimal CPU usage. The multi-core data sharing technology in FreqAnalyst Multi and StereoScope Multi is the key design reason: instead of running independent analysis engines per track, one shared engine feeds all display instances. That's a smart architecture.
Running 16 simultaneous spectrum curves during a mix without noticing CPU impact is not a small claim. For the bundle to be useful in the way it's designed to be used, it has to stay out of your CPU budget. The owner reports suggest it does on Mac. The Windows performance complaints add nuance here: performance issues on Windows are reported alongside the stability problems, so the lightweight reputation may be platform-dependent.
Computer Music Magazine gave the bundle 9/10 with performance and innovation awards. That's a meaningful score and the award categories line up with what the bundle actually does well. Plugin Boutique users across 7 reviews gave it 5.0, though recent independent user reviews beyond the 2008-2011 era are limited. The picture is thinner for more recent performance on current operating systems.
If you're on a modern Mac running current macOS, the CPU story looks good. If you're on Windows, particularly Windows 10 with Pro Tools, the situation is less clear and the reported crashes during installation are a real concern before you commit.
The Visual Design Problem
It needs to be said directly: the interface looks old. The minimal discussion around modern visual design in the owner and reviewer community suggests this hasn't been a priority for Blue Cat Audio with this bundle, and it shows.
That matters for a reason beyond aesthetics. When you're making fast decisions during a mix session, your analysis tools need to give you information quickly and legibly. A dated visual design can mean smaller text, less contrast, more cluttered layouts, and display choices that made sense on monitors of a decade ago but strain on a high-DPI screen today.
But the absence of praise for the interface is itself a signal. Owners talk about workflow integration, envelope precision, and display customisation. Nobody is talking about how good it looks. When an analysis plug-in has 16 simultaneous curves on screen, the clarity of the visual design is not a cosmetic detail. It's a functional one.
If you're evaluating the bundle and have access to a trial, check the interface on your actual monitor at your actual resolution before you decide. What reads fine on a 1080p screen might need squinting on a Retina display, or vice versa.
Where It Shines
The clearest strength is the multi-track simultaneous display. FreqAnalyst Multi and StereoScope Multi with up to 16 curves each give you a session-wide view of frequency content and stereo image that individual analyzers, however good, can't match by definition.
K-System support in DP Meter Pro, specifically K-12, K-14, and K-20, is a real differentiator for anyone working to broadcast or streaming loudness standards. Having the scale built in and switchable means you're not running a separate loudness meter alongside your dynamic meter.
The mid-side capability across multiple tools is another strength. DP Meter Pro, FreqAnalyst Pro, and StereoScope Pro all support mid-side analysis. When a full bundle handles mid-side coherently across metering, spectrum, and stereo imaging simultaneously, your mid-side mastering workflow gets tighter because every read you're making is consistent.
The MIDI and automation output system is genuinely clever and underrated. Most analysis tools stop at display. This one turns display data into control data.
Owners report that DAW integration with this bundle is superior to external analysis tools. That means less alt-tabbing, less disconnect between what your analyzers show and what your DAW controls, and faster decisions in the session.
Against the Field
Two products come up alongside the Analysis Pack in comparison discussions, and they tell different stories about who this bundle is for.
SPL Hawkeye is mentioned for highly technical metering work. If your primary need is a metering tool built for broadcast compliance and professional loudness standards, SPL Hawkeye is the focused comparison. The Analysis Pack is broader: six tools versus a dedicated metering environment. If you need depth in one specific area over breadth across six, SPL Hawkeye is a reasonable alternative to consider at that intersection.
Melda plugins come up in a different context. They're noted as more difficult to use than the Analysis Pack. That's a meaningful data point. If you've looked at MAnalyzer or MStereoScope and found the interface overwhelming, the Analysis Pack's workflow may feel more approachable. The comparison suggests the Analysis Pack sits in a usability-to-depth balance that works well for engineers who want serious analysis without a learning cliff.
Beyond those two named comparisons, the bundle's closest competitors in the broader market are analysis suites from iZotope and from various DAW-native meter sets. But those products aren't in the notes, so the honest call is to flag that the named comparisons favour the Analysis Pack on usability and breadth, while SPL wins on pure metering focus.
Who Should Buy This
- ✅ Buy if you mix dense sessions with multiple competing instruments and need to see frequency overlap across 16 tracks simultaneously in real time.
- ✅ Buy if you work in post-production or broadcast where K-System metering, mid-side analysis, and automation output from your meters are part of your standard workflow.
- ✅ Buy if you're on Mac and want a stable, lightweight multi-tool analysis bundle that integrates inside your DAW rather than running as an external application.
- ❌ Skip if you're on Windows running Pro Tools and can't afford session instability during installation or when moving plug-ins between tracks.
- ❌ Skip if you need a visually modern interface and clear high-DPI display, because this bundle has not kept pace with current UI standards.
- ❌ Skip if you only need one specific type of analysis, like loudness metering or just a spectrum analyzer. A single focused tool will serve you better than a bundle you'll use two out of six pieces of.
Specs & Technical Details
| Developer | Blue Cat Audio |
| Price | N/A |
| Plugin Format | VST / VST3 / AU / AAX |
| OS Support | Mac (10.7 and above, including Catalina and Big Sur) / Windows (7, 8, 10) |
| Activation | N/A |
| CPU Usage | Light (owner-reported; multi-core data sharing technology used in multi-track analyzers) |
| Trial Available | N/A |
| Version Reviewed | N/A |
Score Breakdown
| Category | Score | Notes |
|---|---|---|
| Sound Quality | 4.5/5 | Analysis accuracy is the core function and owners report reliable, precise readouts across all six tools |
| Value for Money | 4.0/5 | Six dedicated analysis tools in one bundle represents real coverage, though the dated design softens the value proposition slightly |
| Ease of Use | 3.5/5 | More accessible than Melda equivalents per comparisons, but dated interface and Windows reliability problems cost points |
| Features | 4.5/5 | MIDI and automation output from analyzers, 16-curve multi-track display, K-System metering, mid-side across multiple tools: the feature set is deep |
| CPU Efficiency | 4.5/5 | Multi-core data sharing keeps CPU load low; owner reports confirm lightweight performance, primarily on Mac |
| Overall | 4.2/5 | A serious analysis bundle with a genuinely clever control architecture, docked for Windows problems and a UI that hasn't aged gracefully |
Alternatives to Consider
SPL Hawkeye is the alternative if metering is your primary concern and you want a tool built from the ground up for technically demanding loudness work. The Analysis Pack is broader. SPL Hawkeye is deeper in one specific zone. If you're doing broadcast compliance work and metering is 80% of your analysis need, it's worth comparing directly.
Melda Production MAnalyzer / MStereoScope (or the full MCompleteBundle) covers similar ground on spectrum and stereo analysis. The comparison notes flag Melda as harder to use than the Analysis Pack. If you've already invested in Melda and are comfortable with the interface, the overlap between the two is significant enough that you probably don't need both. If you haven't, the Analysis Pack's workflow may feel more immediately accessible, though Melda has the edge on interface modernity.
iZotope Insight 2 is the third-party name that comes up most often in modern loudness and metering discussions, though it's not in the direct comparison notes for this bundle. It's worth flagging as a modern alternative with a current UI and strong loudness metering for broadcast and streaming. If the dated interface of the Analysis Pack is a barrier and metering plus basic spectrum analysis covers your needs, Insight 2 is a genuine modern option to evaluate. The Analysis Pack's multi-track simultaneous display across six tool types is the differentiator if that workflow matters to your sessions.
The Honest Closing Call
Blue Cat's Analysis Pack is built for the kind of engineer who wants to see everything at once and act on what they see. The six tools work together. The multi-track display is legitimately useful in a way that individual analyzers can't be. The MIDI and automation output from your metering and spectrum data is a workflow idea that's quietly ahead of where most analysis tools sit.
The Windows stability problems are real and they're not a footnote. If you're running Pro Tools on Windows and crashing during installation is a known issue, that's a conversation-stopper until there's a confirmed fix for your specific setup.
If you're mixing dense sessions on Mac and you want a single bundle that covers every layer of signal analysis without hammering your CPU, this bundle earns its place in your plug-in folder. The dated interface is annoying but it doesn't break the workflow.
Computer Music Magazine awarded a 9/10 rating and Plugin Boutique users gave a 5.0 average across 7 reviews, though recent independent reviews beyond the 2008-2011 era are limited. That's a real caveat. Check whether Blue Cat Audio has updated the bundle for your OS version before you commit, and if there's a trial, run it on your actual session before the sale closes.
The bundle earns a 4.2 for what it does and how it integrates. It would score higher if the Windows experience was cleaner and the interface had seen a modern redesign. As it stands: buy it on Mac for a dense analytical workflow, approach cautiously on Windows, and don't buy it if you only need one of the six tools.
Frequently Asked Questions
What plug-ins are included in Blue Cat's Analysis Pack?
The bundle includes six plug-ins: DP Meter Pro for multichannel metering, FreqAnalyst Multi and FreqAnalyst Pro for spectrum analysis, Oscilloscope Multi for waveform and phase display, and StereoScope Multi and StereoScope Pro for stereo image analysis. Each handles a different layer of signal analysis and they're designed to be used together across a session.
Does Blue Cat's Analysis Pack work on modern macOS versions?
Yes. The bundle supports macOS from 10.7 onwards and includes specific support for Catalina and Big Sur. It works with Audio Units, VST, VST3, and AAX compatible DAWs on Mac. Owner reports suggest stable and lightweight performance on Mac specifically.
Are there known problems with the Windows version?
Yes. Reviewers report Pro Tools crashes on Windows during installation and when moving plug-ins between tracks. There are also broader performance complaints on Windows that go beyond the Pro Tools-specific issue. If you're on Windows, particularly in Pro Tools, verify compatibility before purchasing.
How many tracks can FreqAnalyst Multi and StereoScope Multi display simultaneously?
Both FreqAnalyst Multi and StereoScope Multi support up to 16 simultaneous curves on the same screen in real time. Each curve represents a separate audio track in your session. The multi-core data sharing technology is what keeps the CPU load manageable at that number of simultaneous displays.
Can the plug-ins output MIDI or automation data?
Yes, and this is one of the more distinctive features of the bundle. DP Meter Pro records measurements as automation curves and outputs MIDI CC messages. FreqAnalyst Pro generates automation envelopes or MIDI CC messages from minimum and maximum frequencies and energy centre. StereoScope Pro outputs MIDI CC tracking minimum and maximum stereo field positions and perceived position. This turns each analyzer into a potential control source for downstream plug-in parameters.
What is the K-System and why does it matter in DP Meter Pro?
The K-System is a metering calibration standard developed by mastering engineer Bob Katz. It defines three scales: K-20 for classical and film, K-14 for most music, and K-12 for broadcast. Having the correct scale loaded calibrates your monitoring level to the target medium, which keeps your loudness decisions consistent rather than relative. DP Meter Pro supports all three K-System scales plus custom scales.
How does the bundle handle mid-side analysis?
Several tools in the bundle support mid-side mode. DP Meter Pro analyzes mono, stereo, mid-side, and surround audio. FreqAnalyst Pro offers mono, stereo, or mid-side spectrum analysis. Oscilloscope Multi includes stereo or mid-side waveform extraction. Having mid-side analysis consistent across metering, spectrum, and waveform tools in the same bundle means your mid-side workflow reads from the same picture rather than cross-referencing separate tools.
Is Blue Cat's Analysis Pack suitable for casual users or beginners?
The bundle is designed primarily for serious dedicated signal analysis rather than casual use. The feature depth across six specialist tools, the MIDI output architecture, and the multi-track simultaneous display are built for mixing engineers, mastering engineers, and post-production professionals who need analytical precision rather than a quick visual reference. Beginners would likely find the depth overwhelming before they find it useful, and a single focused tool would serve them better.